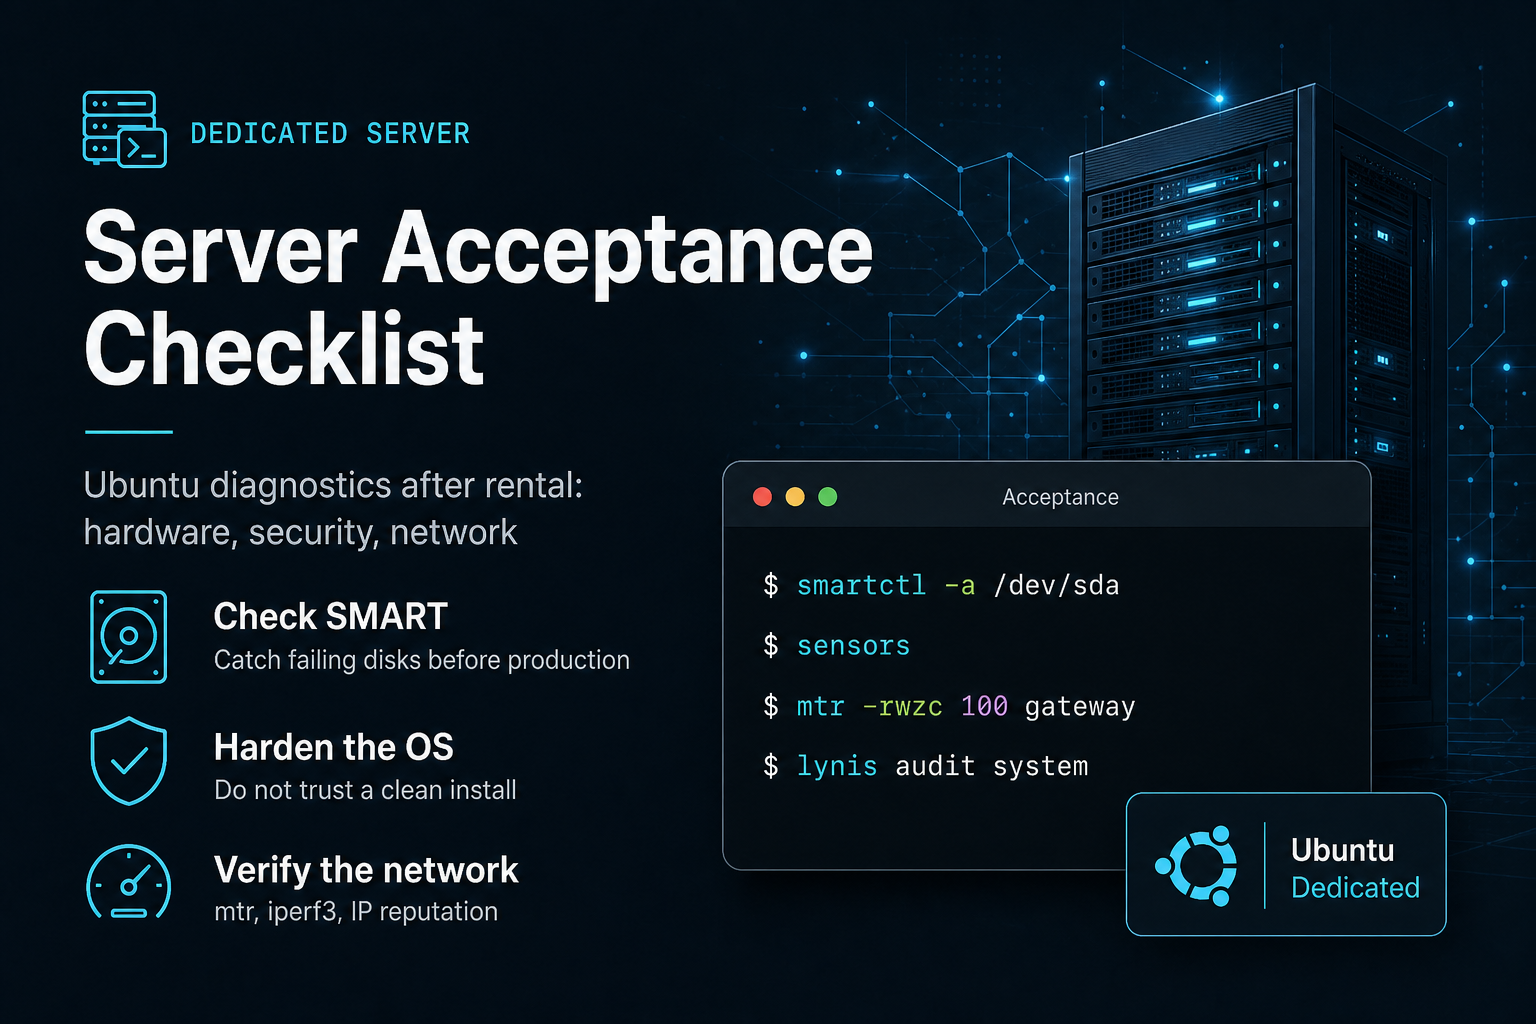
In 17 years of building highload services, I have rented dozens of dedicated servers. Every time, the first hour after getting root is not project setup — it is a full hardware check. Even top-tier hosts sometimes hand out worn disks and hidden defects.
A cloud VPS can be rebuilt in a minute. A dedicated server is physical hardware with a wear history. Downtime hits both revenue and SEO: uptime drops, timeouts grow, IP reputation suffers. On highload projects, “we will check it later” almost always costs more than 30 minutes of acceptance diagnostics.
This article is a practical checklist for developers and admins who just received access to a new Ubuntu dedicated box: four stages, copy-paste commands, and a short automation script.
- Hardware: SMART, temperatures, RAID, kernel errors
- Does the machine match the plan?
- Security and a clean OS
- Network: ping, loss, real throughput
- Automation and saving the report
1. Hardware: check what you cannot reinstall
Key point: software can be reinstalled. A failing disk or an overheating CPU means downtime and a support ticket. On a highload service, a bad disk means business downtime and lost customers.
Disk SMART
sudo apt update
sudo apt install -y smartmontools
sudo smartctl -a /dev/sda
# NVMe:
sudo smartctl -a /dev/nvme0n1
Do not stop at a single PASS/FAIL line — read the attributes. Hosts do not always treat issues as warranty cases. The earlier you capture a report, the easier it is to argue with facts.
| Attribute | Meaning | Open a ticket when |
|---|---|---|
Reallocated_Sector_Ct | Reallocated sectors | Any value > 0 on a new server |
Current_Pending_Sector | Sectors waiting to be remapped | Any value > 0 |
Offline_Uncorrectable | Uncorrectable errors | Any value > 0 |
UDMA_CRC_Error_Count | Cable/port errors | Count keeps growing |
NVMe Media and Data Integrity Errors | Media errors | Any value > 0 |
Temperatures
sudo apt install -y lm-sensors
sudo sensors-detect --auto
sensors
# NVMe:
sudo smartctl -A /dev/nvme0n1 | grep -i temperature| Component | Idle | Under load | Red flag |
|---|---|---|---|
| CPU | 30–55 °C | 60–80 °C | > 85 °C at idle |
| NVMe | 30–45 °C | 50–70 °C | steady > 75–80 °C |
| HDD | 30–40 °C | 40–50 °C | > 55 °C for a long time |
Kernel errors and MCE
sudo dmesg -T | grep -iE 'error|fail|mce|hardware|I/O error|ata.*exception'
journalctl -k -p err..alert --no-pager | tail -n 100
MCE (Machine Check Exception) is a hardware fault in CPU, memory, or the bus. On a fresh machine it is a red flag — not log noise. Open a ticket before you deploy production.
RAID
# Software RAID
cat /proc/mdstat
sudo mdadm --detail /dev/md0

# Hardware controller (often LSI/Adaptec)
sudo apt install -y megacli storcli 2>/dev/null || true
sudo storcli /c0 /vall show
# or
sudo megacli -LDInfo -Lall -aAll
Status should be Optimal / [UU] for a mirror. Degraded, rebuild, or a missing disk means support now — not “wait until rebuild finishes” on a production box.
Stress test (optional, useful at acceptance)
sudo apt install -y stress-ng memtester fio
# CPU + RAM for ~30 minutes
sudo stress-ng --cpu 0 --vm 2 --vm-bytes 75% --timeout 30m --metrics-brief
# Memory (4 GB example)
sudo memtester 4G 1
# Disk sequential read/write
sudo fio --name=seq --filename=/tmp/fio.test --size=4G --bs=1M --rw=readwrite --iodepth=16 --runtime=60 --time_based
Why run 30 minutes at acceptance: many memory and power defects show up under load, not at idle. Rising temperatures, MCE storms, or I/O errors during the test mean you do not accept the server for production.
Escalate to support immediately:
- bad / pending sectors / media errors;
- MCE or hardware errors in dmesg;
- CPU temperature > 85 °C at idle;
- RAID not Optimal / degraded;
- RAM, disks, or network clearly below the ordered plan.
2. Plan match: did you get what you paid for?
A five-minute “expected vs actual” check often catches a swapped CPU model, wrong RAM size, or 1G instead of the promised 10G.
lscpu
free -h
lsblk -o NAME,SIZE,TYPE,MODEL,ROTA,TRAN
sudo dmidecode -t memory
ip -br link
# replace eth0/ens3 with your interface
sudo ethtool eth0| Parameter | Command | What to verify | Expected |
|---|---|---|---|
| CPU | lscpu | Cores, threads, frequency, model | Matches the plan |
| RAM | free -h + dmidecode -t memory | Size, type, DIMM speed | Plan capacity, no ECC errors in logs |
| Disks | lsblk + smartctl | Size, model, SMART | No bad sectors, size as ordered |
| Network | ethtool eth0 | Speed, Duplex | 1G/10G, Full |
Tip: save command output to a dated file. In a dispute with the host, “your panel says X” is weaker than your own timestamped report from a fresh machine.
3. Security and OS cleanliness: do not trust a “clean install”
A “clean Ubuntu image from the host” is not hardening. Sometimes the image already has extra ports open, unknown services running, or an IP that landed on blocklists after a previous tenant.
Minimum hardening
- Updates:
sudo apt update && sudo apt upgrade -y - SSH keys instead of passwords; disable root password login
- UFW: only required ports
- fail2ban for SSH
A deeper walkthrough of the baseline setup is in the Linux Survival Guide: SSH, UFW, Fail2ban, permissions, and logs.
Compromise checks
ss -tulnp
ps auxf
crontab -l
sudo ls -la /etc/cron.* /var/spool/cron/crontabs 2>/dev/null
last -a | head
sudo lastb | head
# suspicious binaries with network activity
sudo lsof -i -P -n | head -n 50
Look for foreign cron jobs, unknown high-CPU processes, listening ports outside your stack, and bursts of failed logins — classic miner and leftover-backdoor patterns on reused hardware.
Rootkit / configuration audit
sudo apt install -y lynis
sudo lynis audit system
Lynis does not “heal” the system — it produces a finding list. At acceptance, focus on critical items: root password login, weak SSH settings, missing security updates, unnecessary SUID binaries. Close hardening warnings before you deploy the app.
IP reputation and PTR
curl -4 ifconfig.me
dig -x YOUR_IP +short
# quick DNS check
dig google.com +short
Why this matters for SEO services and mail: a dirty IP or a missing/wrong PTR breaks delivery, hurts crawlers and outbound APIs, and can drag reputation onto your domain. Clean structured data helps SEO — the same way clean hardware and a clean IP help uptime and trust. Practical Schema.org guide: Schema.org handbook.
4. Network: ping, loss, real throughput
Link detected: yes does not mean the channel is ready for production.
mtr to the gateway and external targets
sudo apt install -y mtr-tiny
ip route | awk '/default/ {print $3}'
# 100 probes to the gateway (replace with gateway IP)
sudo mtr -rwzc 100 GATEWAY
# external control point
sudo mtr -rwzc 100 1.1.1.1
How to read the output: watch Loss% and latency growth per hop. Acceptable loss on the gateway is roughly < 0.5%. Loss on distant hops can be normal (ICMP rate limiting); loss on hop 1–2 inside the DC is a provider problem.
iperf3: real throughput
sudo apt install -y iperf3
# public test servers change — pick one close to the DC
iperf3 -c speed.test.example -P 4
iperf3 -c speed.test.example -R -P 4
Compare results with the plan (1G ≈ up to ~900–940 Mbit/s useful throughput; 10G scales accordingly). If ethtool shows 10G but iperf barely reaches 200 Mbit/s with no good reason — capture evidence and open a ticket.
DNS
resolvectl status
dig google.com
dig @1.1.1.1 abramov.top
If resolving is unstable, switch resolvers (Cloudflare/Google/provider) before CI, mail, and monitoring land on the box.
5. Automation: a one-liner for a quick start
You do not need every tool. Pick by task.
| Tool | Job | When to use |
|---|---|---|
| YABS | Quick CPU/disk/network bench | First acceptance, plan comparison |
| Lynis | OS security audit | Before production deploy |
| Phoronix Test Suite | Deep benchmarks | Hardware comparison in numbers |
| netdata | Live monitoring | After acceptance, ongoing |
| inxi | Hardware summary | Quick server passport for tickets |
sudo apt install -y smartmontools lm-sensors lshw net-tools curl wget inxi mtr-tiny
# Hardware passport
sudo inxi -Fxz > /root/server_audit_$(date +%F).txt
# SMART for all disks
for d in /dev/sd? /dev/nvme?n1; do
  [ -b "$d" ] || continue
  echo "===== $d =====" >> /root/server_audit_$(date +%F).txt
  sudo smartctl -a "$d" >> /root/server_audit_$(date +%F).txt 2>&1
done
# Quick bench (YABS)
curl -sL yabs.sh | bash | tee -a /root/server_audit_$(date +%F).txt
Why save the report: when problems appear later, this is proof that the server was healthy (or already broken) at acceptance. Hosts replace disks and switch ports — your dated file remains a fact.
Conclusion
Thirty minutes of diagnostics save days of downtime and stress. The order is simple: hardware → plan match → security → network → report to a file. Only then install Nginx, PHP, Docker/Podman, and deploy the project.
Related reading:
- Linux Survival Guide — baseline Ubuntu setup and hardening;
- Schema.org for SEO — how structured data strengthens search (the same way clean hardware strengthens uptime).
Need help with a server audit or highload service setup — message me on Telegram or via the contact page.
Share in the comments what surprises you found when accepting dedicated servers. The natural next step is monitoring and alerting — catching issues before the client calls.
Comments
Comments appear after moderation.
No published comments yet. Be the first.