In the dedicated server acceptance guide we validated hardware, network, and security at the moment you got root. That is day zero. Then real life starts: logs fill the disk, PHP-FPM hits max children, a certificate expires on Saturday, and the client notices before you do.
In 17 years of running services I have seen the same story again and again: “it seemed fine” until uptime dropped, timeouts grew, and rankings or conversion suffered. Monitoring is not dashboards for their own sake. It is how you learn about a problem before the client calls and before a search crawler records a streak of errors.
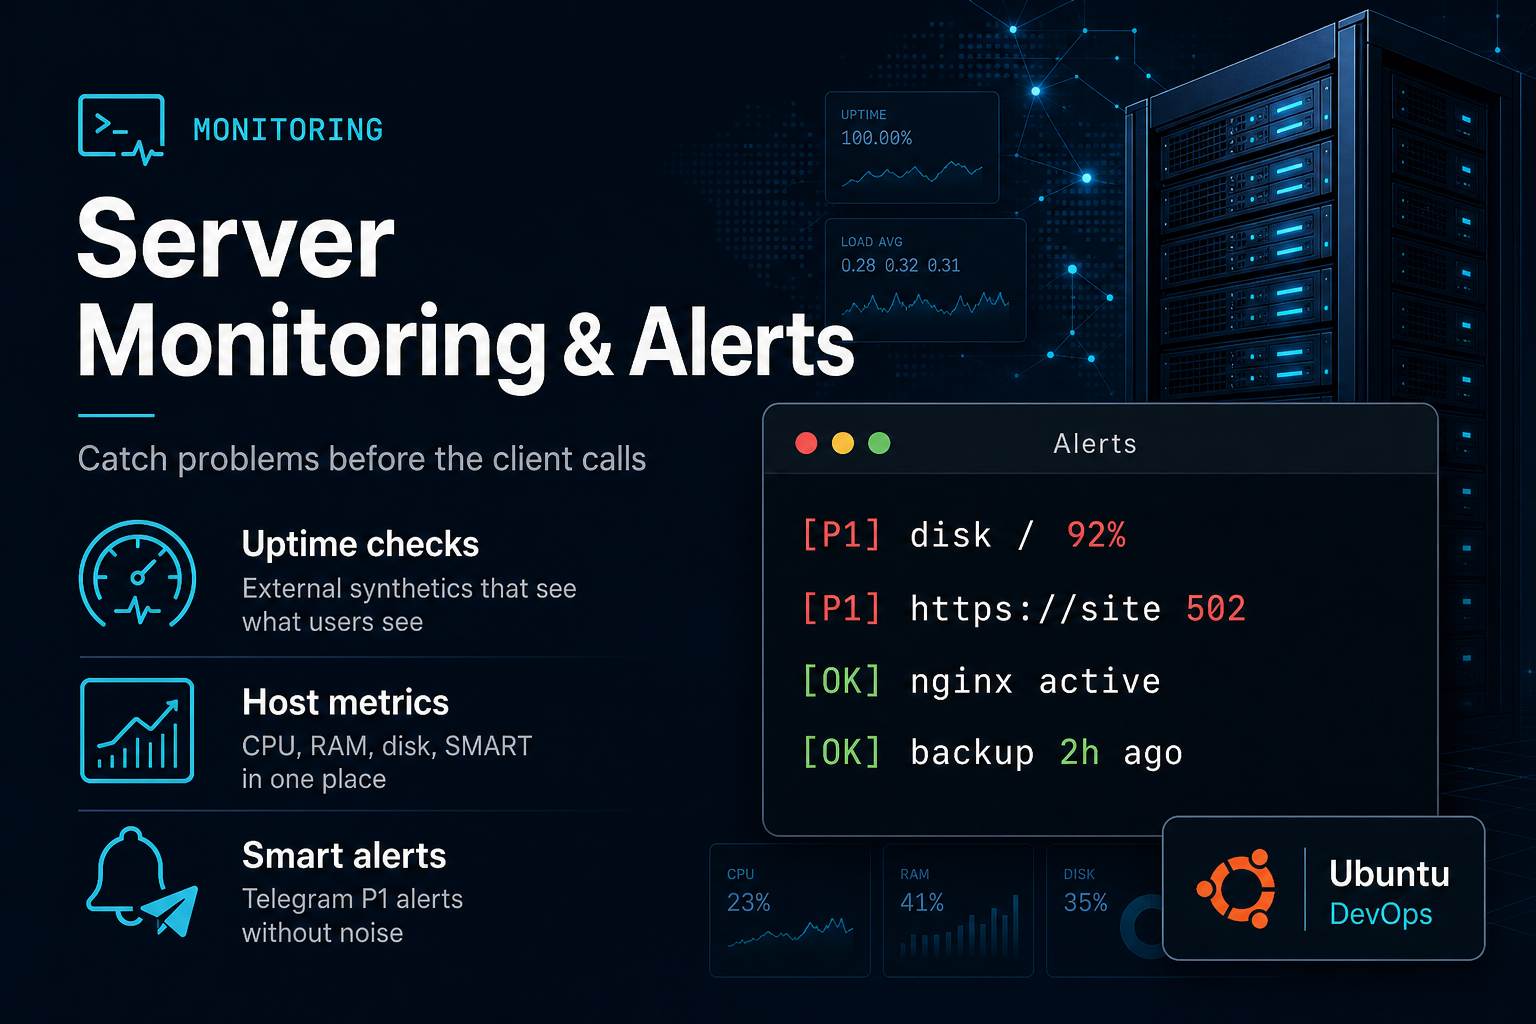
This guide is a practical monitoring and alerting playbook for Ubuntu (VPS and dedicated): what to watch, which thresholds to start with, how to assemble a minimal stack without an enterprise zoo, how to send Telegram alerts, and how to avoid drowning in false positives.
- Why monitoring matters for business and SEO
- Four control layers
- Metrics and thresholds
- Choosing a stack without overload
- External uptime and synthetics
- Host: CPU, RAM, disk, inodes, SMART
- Services: Nginx, PHP-FPM, DB, queues
- Logs, journald, and security
- Alerting: priorities and anti-noise
- Telegram bot for critical events
- Runbook: what to do on alert
- One-evening launch checklist
1. Why monitoring matters for business and SEO
Key point: monitoring pays for itself in saved revenue and saved nerves, not as a DevOps checkbox. One minute of storefront or SaaS downtime often costs more than an hour of alert setup.
- Uptime — pages, APIs, cabinets, payment webhooks.
- Speed — slow TTFB and timeouts hurt Core Web Vitals and conversion.
- 5xx errors — search and ads see degradation before you open logs.
- SSL / DNS / disk full — classic “site is down while the panel is green”.
Acceptance answers “is the iron healthy now?”. Monitoring answers “will it still be healthy at 03:14 when a backup cron fills the disk?”.
| Signal | Business impact | Catch it earlier |
|---|---|---|
| HTTP 5xx / timeout | Leads, payments, trust | External HTTP check + Telegram |
| Disk > 90% | DB crash, logs, failed deploys | Filesystem + inode thresholds |
| SSL < 14 days | Browser warnings, broken APIs | Certificate expiry check |
| Growing queue | Mail/webhooks stuck | Queue depth metric |
| Load / PHP-FPM full | Slow site, SEO drag | Latency + pool utilization |
2. Four control layers
| Layer | Question | Examples | Frequency |
|---|---|---|---|
| External synthetics | Does the user reach the site? | HTTP 200, SSL, DNS, HTML keyword | 1–5 min |
| Host | Does the machine have resources? | CPU, RAM, disk, inode, temperature, SMART | 15–60 sec |
| Services | Is the app stack alive? | nginx, php-fpm, mysql, redis, queue worker | 30–60 sec |
| Business signals | Does the product still do work? | Mail queue, backup cron, webhook delivery | 1–15 min |
Practice: for one or two servers you do not need a Prometheus cluster on day one. You need external uptime + local metrics + 5–10 clear alerts. Add complexity when you have a fleet or on-call rotations.
3. Metrics and thresholds
| Metric | Warning | Critical | Note |
|---|---|---|---|
| Disk used | > 80% | > 90% | Watch / and DB/backup volumes separately |
| Inode used | > 80% | > 90% | Common “space left but cannot write” |
| Load average (per CPU) | > 1.0 | > 2.0 sustained | Ignore one deploy spike |
| RAM available | < 15% | < 8% + swap thrash | Prefer available over free |
| HTTP latency | > 1–2 s | > 5 s / timeout | External synthetic beats local curl |
| 5xx rate | > 1% | > 5% / burst | Use a 5–15 minute window |
| SSL expiry | < 21 days | < 7 days | Alert in business hours + reminder |
| Backup age | > 26 h | > 48 h | Unverified backups are wishful thinking |
| Queue depth | rising 15+ min | rising + worker down | Define your own baseline |
df -hT
df -i
free -h
uptime
nproc
systemctl is-active nginx php*-fpm mysql redis-server 2>/dev/null
4. Choosing a stack without overload
| Job | Simple stack | When to complicate |
|---|---|---|
| External uptime / SSL | Uptime Kuma or a hosted ping service | Multi-region SLA reports for clients |
| Host metrics | Netdata or node_exporter | Shared Grafana across dozens of hosts |
| Human alerts | Telegram bot | PagerDuty/Opsgenie for 24/7 on-call |
| App logs | journalctl + rotation + grep alerts | Loki/ELK when logs are huge daily |
| Business health | Custom /health | Full SLO dashboards |
Recommended minimum for one Ubuntu server: Uptime Kuma on another small VPS, Netdata on the host, Telegram for alerts, app
/health, cron checks for backup age and SSL expiry.
5. External uptime and synthetics
- Homepage: HTTP 200, timing, key HTML string present.
- Critical API/form health — not only “image loads”.
- HTTPS certificate chain validity.
- DNS A/AAAA points where you expect.
- Redirect policy:
http → https,www → apexif intended.
curl -sS -o /dev/null -w '%{http_code} time=%{time_total}\n' https://abramov.top/ru
curl -sSI https://abramov.top/ru | head -n 20
echo | openssl s_client -servername abramov.top -connect abramov.top:443 2>/dev/null \
  | openssl x509 -noout -dates -subject
Important: the watcher must not live on the same machine it watches. Otherwise the outage kills the messenger too.
- Alert after 2–3 failures in a row.
- 60–180 second interval for critical URLs.
- Separate monitors by severity: site / admin / payment API.
- Always send recovery notices.
6. Host: CPU, RAM, disk, inodes, SMART
df -hT
df -i
du -xh /var/log 2>/dev/null | sort -h | tail -n 20
sudo journalctl --disk-usage
free -h
vmstat 1 5
sudo smartctl -H /dev/sda
sudo smartctl -A /dev/sda | grep -iE 'Reallocated|Pending|Uncorrect|Temperature|Media'
Typical disk killers: unrerotated Nginx/PHP logs, backups under /var, old Docker layers, Laravel storage/logs, unlimited journald. SMART growth in reallocated/pending sectors is the ongoing version of the acceptance checklist.
7. Services: Nginx, PHP-FPM, DB, queues
systemctl is-active nginx
systemctl status php8.3-fpm --no-pager -l | head
sudo mysqladmin ping
curl -sS https://example.com/health
# expect something like: {"status":"ok","db":true,"cache":true,"queue":"ok"}
Red flags: nginx/php/mysql inactive, max children reached, rising 5xx, queue depth growing while workers are dead. Do not cache /health aggressively on CDN; restrict it by monitor IP or a secret header.
8. Logs, journald, and security
sudo dmesg -T | grep -iE 'error|fail|mce|oom|out of memory' | tail
sudo journalctl -p err..alert --since '30 min ago' --no-pager
sudo fail2ban-client status sshd 2>/dev/null
Alert on bursts of 5xx, PHP fatals / OOM, disk I/O or MCE, anomalous SSH success from new IPs — not on every bot probe. Hardening basics are in the Linux Survival Guide.
9. Alerting: priorities and anti-noise
| Priority | When | Channel | Examples |
|---|---|---|---|
| P1 Critical | Clients broken now | Telegram + sound | Site 5xx, disk 95%, DB down, SSL expired |
| P2 High | Becomes P1 soon | Telegram | Disk 85%, SSL < 7 days, worker down |
| P3 Medium | Business hours | Digest / quiet channel | Latency creep, SMART warning |
| P4 Info | Context | Log channel | Deploy done, backup ok, recovery |
- Confirm with 2–3 failed checks.
- Use rate windows, not single spikes.
- Deduplicate reminders every 10–15 minutes until recovery.
- Quiet hours for P3; P1 always wakes you.
- One on-call channel beats twelve muted groups.
- Every alert needs an action — otherwise it is just a chart.
10. Telegram bot for critical events
TOKEN="123456:ABC"
CHAT_ID="123456789"
TEXT="P1: https://example.com has returned 502 for 3 minutes"
curl -sS -X POST "https://api.telegram.org/bot${TOKEN}/sendMessage" \
  -d chat_id="${CHAT_ID}" \
  --data-urlencode text="${TEXT}"
#!/usr/bin/env bash
# /usr/local/bin/check-disk-alert.sh
set -euo pipefail
THRESH=90
USED=$(df -P / | awk 'NR==2 {gsub(/%/,"",$5); print $5}')
STATE_FILE=/tmp/disk_alert_root.state
TOKEN_FILE=/root/.secrets/tg_token
CHAT_FILE=/root/.secrets/tg_chat
if [ "$USED" -ge "$THRESH" ]; then
if [ ! -f "$STATE_FILE" ]; then
TOKEN=$(cat "$TOKEN_FILE")
CHAT=$(cat "$CHAT_FILE")
MSG="P1: disk / is ${USED}% full on $(hostname)"
curl -sS -X POST "https://api.telegram.org/bot${TOKEN}/sendMessage" \
-d chat_id="${CHAT}" --data-urlencode text="${MSG}" >/dev/null
touch "$STATE_FILE"
fi
else
rm -f "$STATE_FILE"
fi11. Runbook
| Alert | First 5 minutes | If still broken |
|---|---|---|
| HTTP 5xx | Check nginx/php status, error.log, disk | Rollback / maintenance / host ticket |
| Disk > 90% | df, du on logs, rotate, prune old backups | Grow disk / move logs |
| DB down | mysqladmin ping, DB journal, disk, RAM | Restore last verified backup |
| SSL < 7 days | Manual renew, check certbot/acme cron | Reissue and fix nginx |
| SMART pending | Reduce write load, full smartctl report | Host ticket, migrate data |
12. One-evening launch checklist
- List 5 user journeys that must not break.
- Run external uptime on another host.
- Add HTTP + SSL + DNS checks with anti-flap.
- Install Netdata (or node_exporter) on production Ubuntu.
- Alert on disk/inode, low RAM, critical unit down.
- Ship app
/health(DB + cache minimum). - Hourly backup-age check, alert if older than 24h.
- Telegram: keep P1/P2 away from noise channels.
- Write a runbook for the top 5 alerts.
- Game-day on staging: break something, confirm the alert arrives.
- Weekly 15-minute review of false positives.
- Monthly SMART/temperature/RAID hygiene linked to acceptance.
13. Monitoring through an SEO lens
- Availability affects crawl trust.
- Load-time under traffic beats a lab Lighthouse screenshot.
- Sudden 500s on category pages are worse than a slow 200.
- SSL/redirect mistakes break crawling.
- Synthetics can assert title/H1/key blocks, not only status codes.
Structured data helps machines understand pages — see the Schema.org guide. Unstable hosting still wins (badly) over perfect JSON-LD.
Server acceptance gives an honest baseline. Monitoring and alerting keep that honesty every day: you learn about disk, 5xx, SSL, and dead workers before the client does.
Do not start with a giant observability platform. Start with four layers, about ten clear alerts, Telegram, and a runbook. When noise is under control, deepen the metrics.
Need a monitoring contour for your project — message me on Telegram or via the contact page.
Comments
Comments appear after moderation.
No published comments yet. Be the first.